We implemented a new feature in the Detailed SNP view, which allows the download of allele specific information about a certain SNP. The CSV file contains the sample id, its allele and the phenotypic value.
In addition a variety of bug fixes and performance updates had been deployed.
We added a Representational State Transfer (REST) API to easyGWAS.
This allows users to obtain information from easyGWAS in various forms, simply by using URLs. An example of a REST query is to get all meta-information (e.g. latitude, longitude, and others) of a particular sample.
For example to access meta-information for a sample with id 6944
https://easygwas.biochem.mpg.de/rest/sample/public/6944.jsonFor example to access all public phenotypes
https://easygwas.biochem.mpg.de/rest/phenotype/public/list/We extended the variant annotation pipeline of easyGWAS.
Variants are now also annotated with variant effect predictions from Variant Effect Predictor (VEP).
Therefore, easyGWAS uses the public REST API
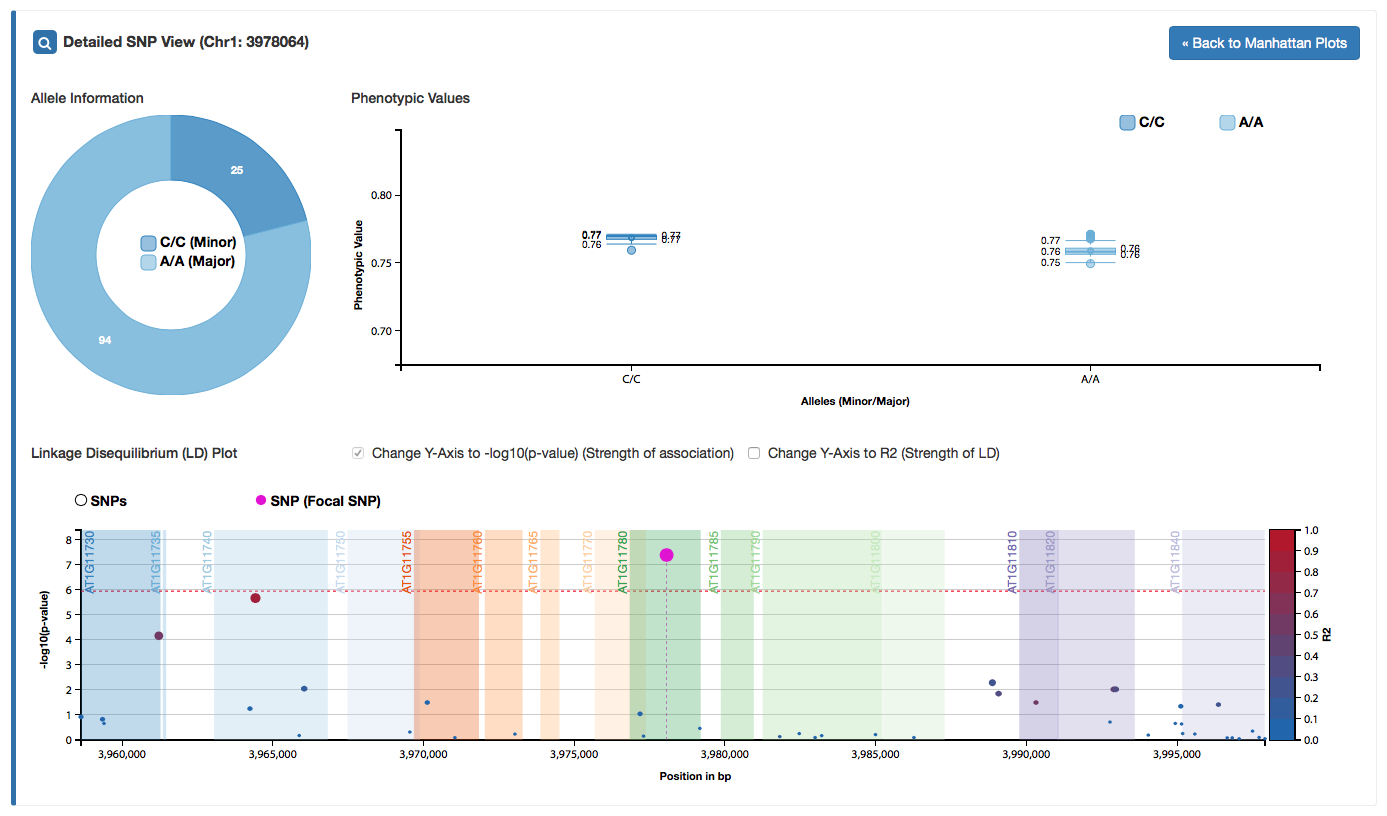
We extended the "Detailed SNP" view. You can access this view by clicking on any SNP in the Manhattan plot or the LD plot in the "Detailed SNP" view.
You can access a demo of the "Detailed SNP" view here: Demo
In addition, we have updated the "SNP Annotation" view. Here, we now added a button which redirects every user to the "Detailed SNP" view for a SNP of interest.
Detailed information about the allele distrbution and its phenotypic values is shown, as well as dynamic linkage disequilibrium plots.
If available, gene annotations are shown in the LD plot.
Click here to see a live example: Demo
User now can compare the results between public and private GWAS!
A live Demo can be found here: Live Demo
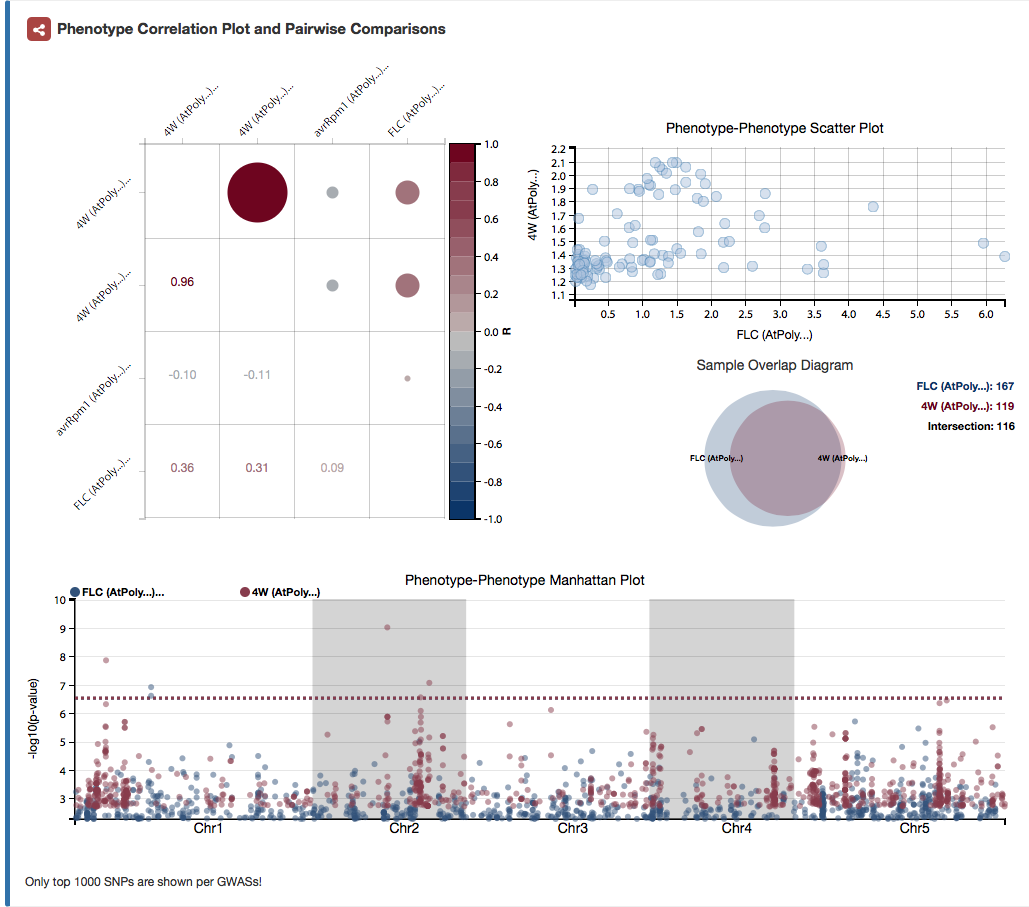
Pairwise Comparison of GWAS
Pairwise comparison of genome-wide association study results. All plots are dynamic. Users can hover with their mouse over any dot in the correlation map at the left. All other plots are automatically updated correspondingly.
The correlation map on the left shows all correlations between the phenotypes used for the individual GWAS.
The phenotype-phenotype scatter plot on the right shows all phenotypic values of phenotype x against all phenotypic values of phenotype y.
The sample overlap plot on the right shows the overlap of samples between the samples of GWAS x and GWAS y.
The phenotype-phenotype manhattan plot at the buttom shows the top 1000 association results of GWAS x and GWAS y.
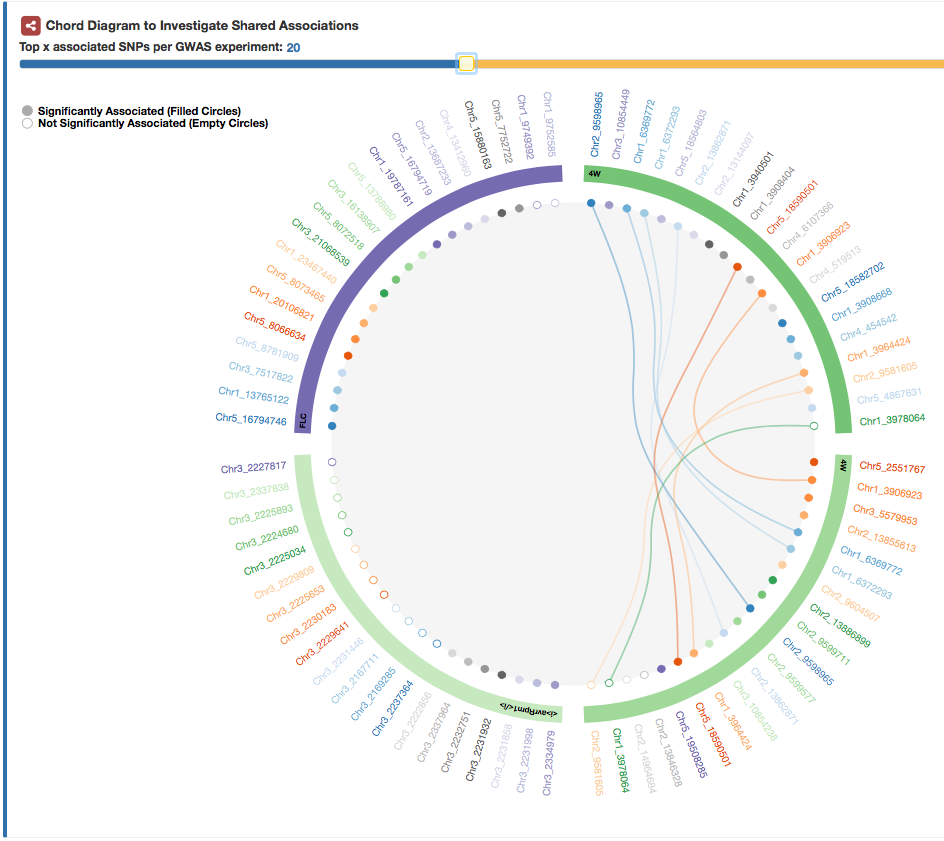
Shared Associations between GWAS
The "Shared Associations" tab shows the top x SNPs for each GWAS experiment.
SNPs that can be found to be associated between different GWAS experiments are linked to each other.
Filled circles are significantly associated SNPs, whereas empty circles are not significantly associated.
User now can upload custom gene annotation sets for public and private species.
Several performance adjustments and bugfixes.